Good day to you all. Today i am going to share with you how to make a pivot table using microsoft excel. If you do not know what is Pivot Table, this is a easy way of presenting multiple information in a table. For example, this is our raw data. We want to have a pivot table of count of persons according to each nationality. Go to Data - Pivot Table and Pivot Chart Report.
 Go to Data - Pivot Table and Pivot Chart Report.
 Click NEXT
 HIGHLIGHT your raw data location. Click the button (circled)
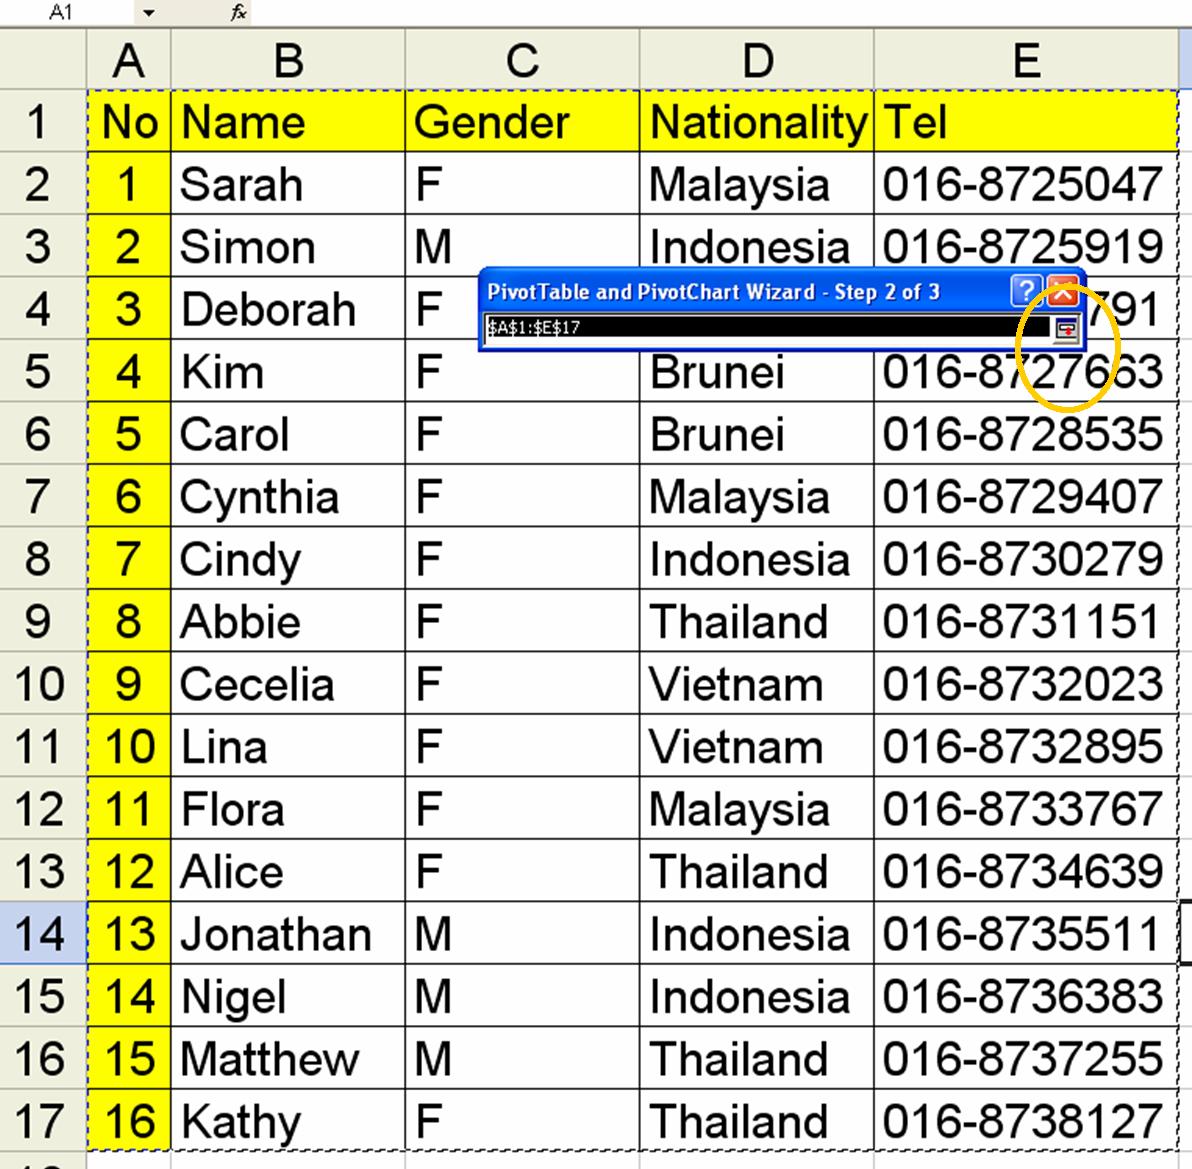 Click NEXT
 Click LAYOUT
 DRAG and DROP button on the right. This is where you decide what info to be displayed on your final pivot table. As you can see, in DATA panel - when you try to drag Gender, it will automatically assumed that you would want it to output count of Gender. If this is not what you desired, just double click the "count of Gender" and select whichever that is preferred.
 Decide where do you want to place the pivot table report. By default, you can keep the NEW worksheet as your choice. Click FINISH.. and you are done.
This is an example of Pivot Table which I have generated with Microsoft Excel's Pivot table. And it is just few clicks involved. Every people should know this

cool.. very useful to get information =)
ReplyDeletekenwooi.com